VIBEPAPA RESEARCH
What Is Driving the Growth of the JLPT in Japan?
Vibepapa Research examines official 1984-2025 data on JLPT applications in Japan, test fees, and the exceptional surge in N4 demand.
The short answer
JLPT growth in Japan is not evenly distributed across levels. From 2019 to 2025, applications at Japan test sites rose 66.5%, while N4 applications climbed from 56,512 to 172,085 - a 204.5% increase. Foreign-resident growth, a changing language-school population, and the practical value of N4 under the Specified Skilled Worker system all align with the shift, but public data do not establish a single causal driver.Key takeaways
- Global JLPT applications reached 1,940,852 in 2025, about 243 times the 1984 level.
- Applications at Japan test sites rose from 479,879 in 2019 to 799,055 in 2025.
- N4 is the central outlier: applications grew 204.5% and its domestic share rose from 11.8% to 21.5%.
- The domestic fee rose from ¥5,500 to ¥7,500, yet aggregate demand continued to expand.
- The evidence supports structural change in demand, not direct attribution to one nationality or policy.
Research question
The JLPT is often discussed as a single, steadily expanding examination market. Aggregate growth is real, but it hides a more informative change: recent expansion at Japanese test sites is concentrated in N3 and, especially, N4 rather than spread evenly across N1-N5.
Different levels can represent different forms of demand. N1 and N2 are commonly associated with advanced academic or professional proficiency. N4 occupies another position: it is both a basic proficiency benchmark and, in several policy contexts, a recognized threshold with practical value.
The study asks how JLPT demand changed over the long run, whether post-2019 expansion in Japan is concentrated in particular levels, and how far demographic and institutional changes can explain the unusually rapid growth of N4.
Data and methodology
The analysis uses official sources from the Japan Foundation and Japan Educational Exchanges and Services, the Immigration Services Agency of Japan, and the Japan Student Services Organization.
Annual Japan-based JLPT applications are calculated by summing the July and December applicant counts. These are application instances, not verified unique individuals: a person applying twice in one year can appear twice. The July 2020 test was cancelled worldwide, so 2020 is treated as an exceptional, non-comparable year.
This is a descriptive study without applicant-level data on nationality, residence status, occupation, or motivation. It therefore separates verified statistical facts, supported interpretations, and causal claims that the public evidence cannot establish.
From 8,000 to 1.94 million: four decades of expansion
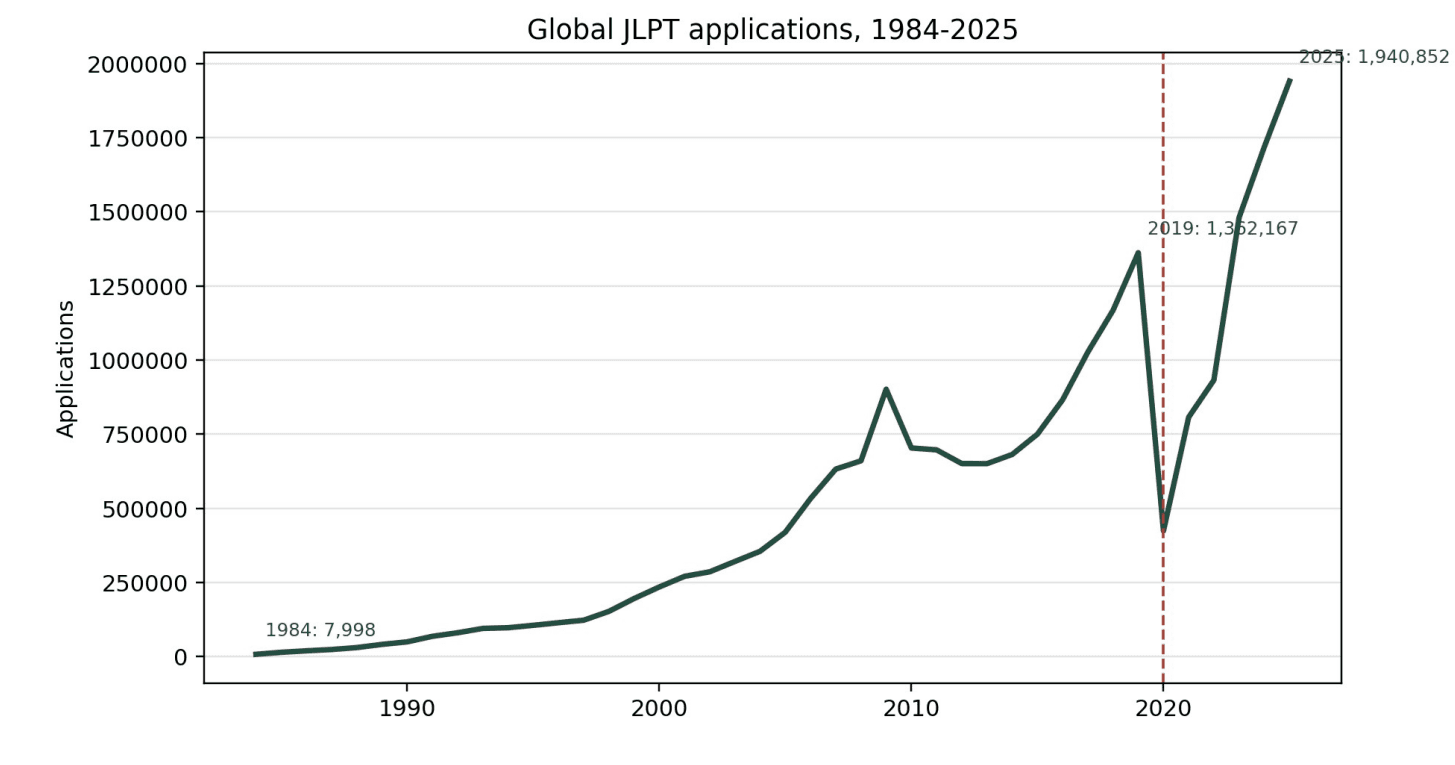
Official statistics report 7,998 applicants in 1984 and 1,940,852 in 2025. The 2025 total is approximately 243 times the inaugural-year count and 42.5% above the 2019 pre-pandemic level.
The pandemic created a sharp break. Only the December session was held in 2020, and mobility remained constrained in 2021 and parts of 2022. Applications then accelerated from 932,518 in 2022 to 1,481,023 in 2023, 1,718,943 in 2024, and 1,940,852 in 2025. The market did not merely recover; it moved materially above its previous scale.
Applications in Japan grew faster than the foreign resident population
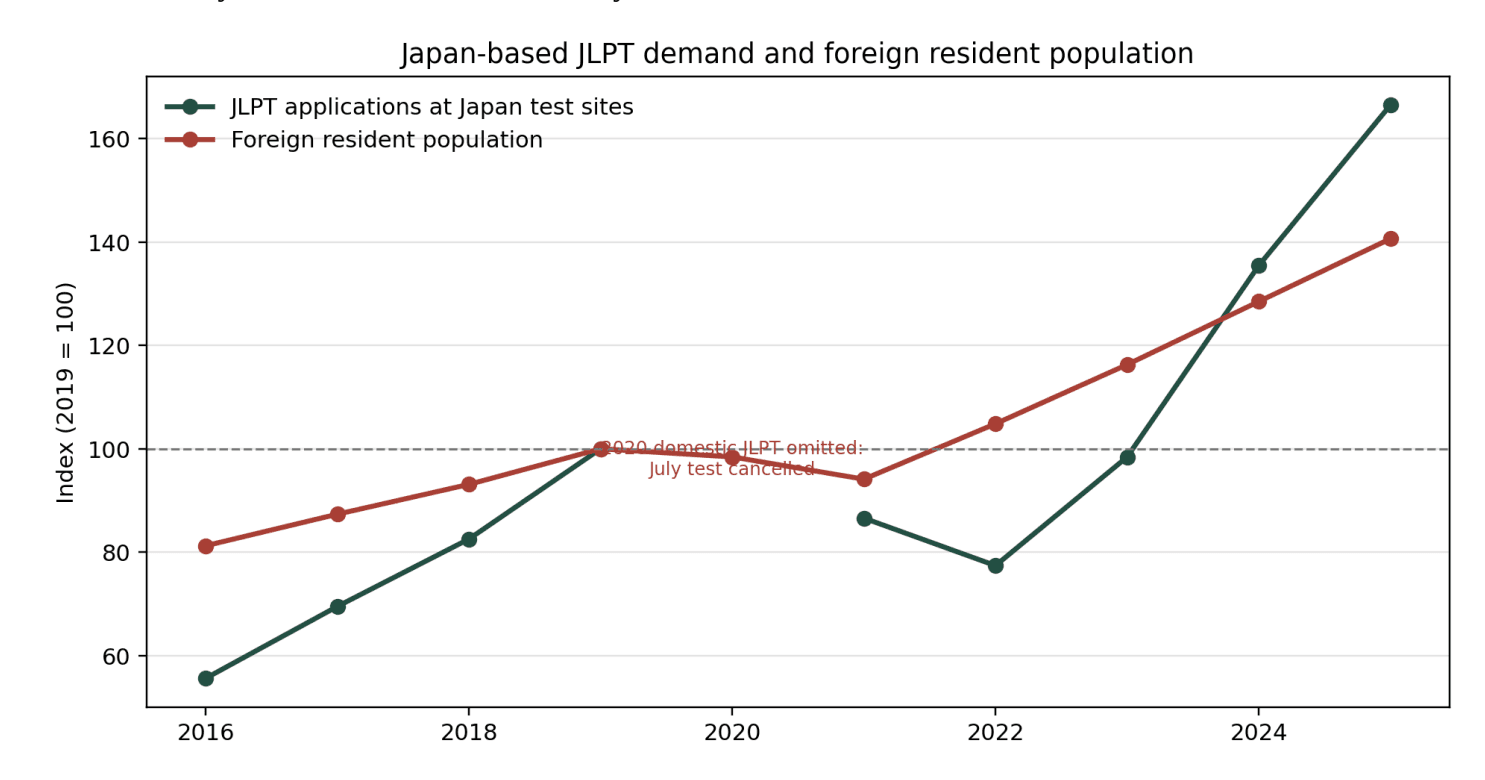
Applications at Japan test sites increased from 479,879 in 2019 to 799,055 in 2025, a 66.5% rise. Over the same period, Japan's foreign resident population increased from 2,933,137 to 4,125,395, or 40.6%.
This comparison is not a participation rate. JLPT figures count annual applications, whereas immigration statistics count residents at a point in time. The narrower inference is that population growth expanded the candidate pool but is unlikely to be a complete explanation for the scale of application growth.
The central finding: N4 is the outlier
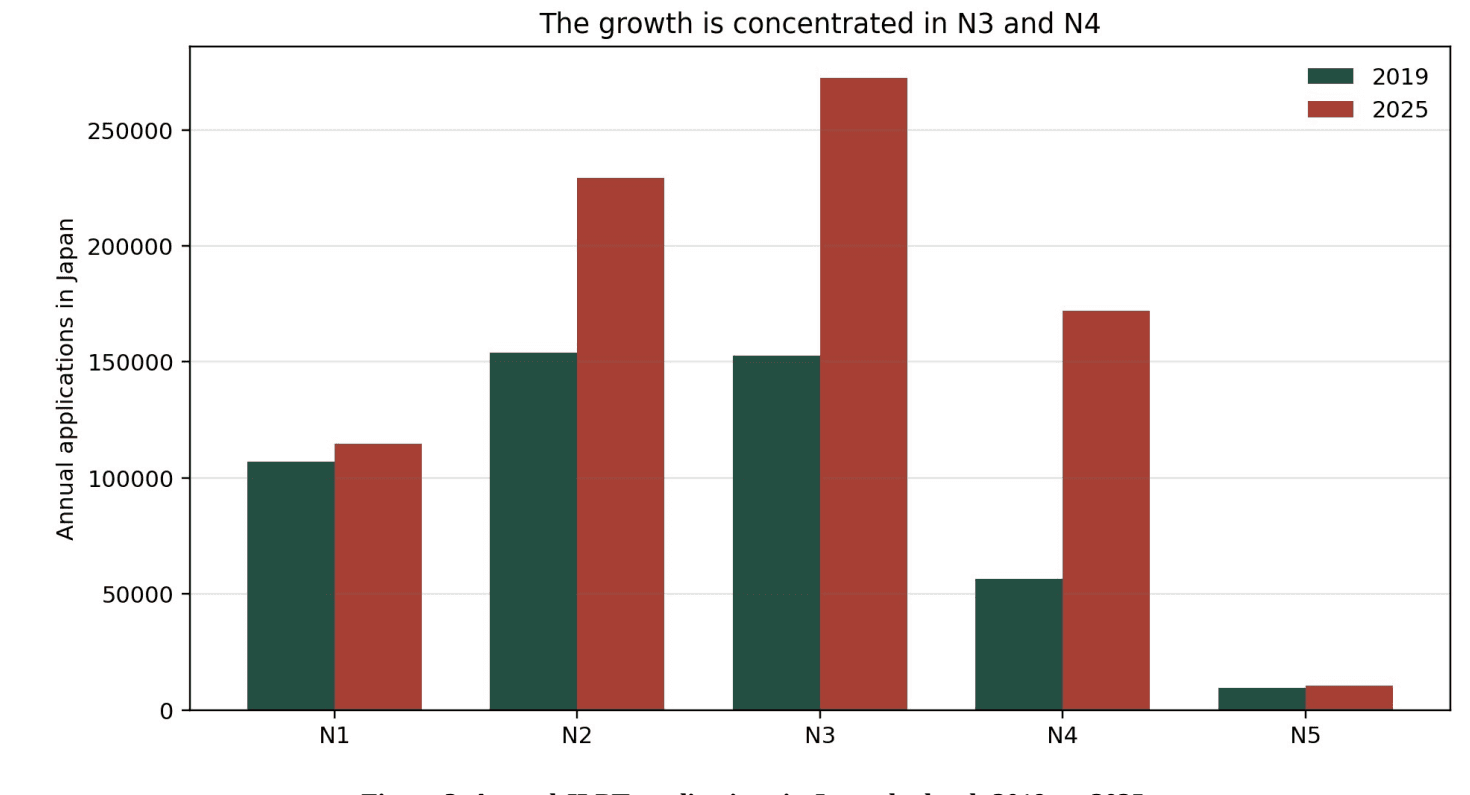
The level-by-level comparison changes the market story. N1 and N5 were comparatively stable, N2 and N3 grew strongly, and N4 rose from 56,512 to 172,085 annual applications - a 204.5% increase.
N4's share of applications at Japan test sites climbed from 11.8% to 21.5%. This is not a single-year anomaly: the N4 total rose from 59,189 in 2022 to 90,570 in 2023, 147,848 in 2024, and 172,085 in 2025.
| Level | 2019 | 2025 | Growth | 2019 share | 2025 share |
|---|---|---|---|---|---|
| N1 | 106,878 | 114,863 | 7.5% | 22.3% | 14.4% |
| N2 | 154,122 | 229,320 | 48.8% | 32.1% | 28.7% |
| N3 | 152,827 | 272,317 | 78.2% | 31.8% | 34.1% |
| N4 | 56,512 | 172,085 | 204.5% | 11.8% | 21.5% |
| N5 | 9,540 | 10,470 | 9.7% | 2.0% | 1.3% |
Source: Official JLPT July and December statistics; annual totals calculated by Vibepapa Research.
Higher fees did not stop aggregate demand growth
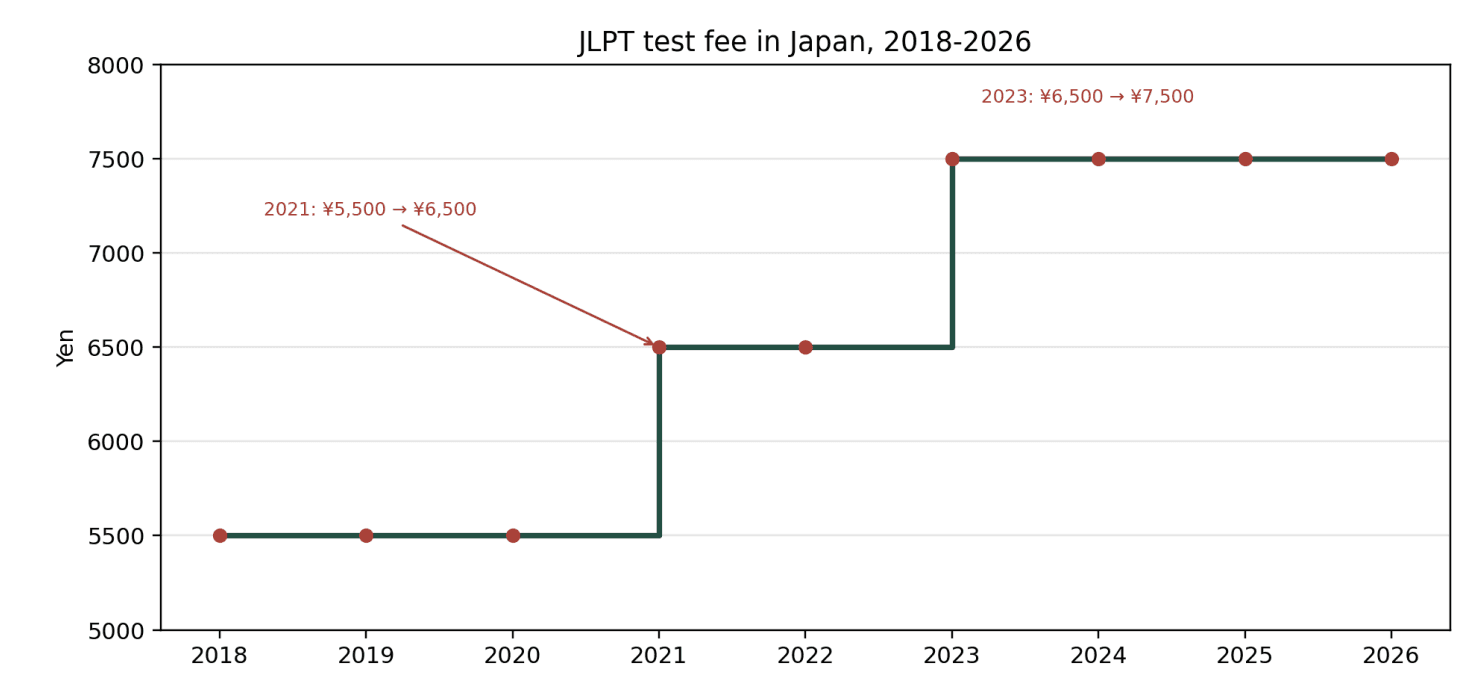
The domestic JLPT fee was ¥5,500 in 2019 and 2020. It rose to ¥6,500 in 2021 and to ¥7,500 in 2023; the fee remains ¥7,500 in 2026.
From 2019 to 2025, the nominal fee increased 36.4% while Japan-based applications increased 66.5%. This is not an estimate of price elasticity because border reopening, foreign-resident growth, student inflows, and labor-migration pathways changed simultaneously. The defensible conclusion is that the fee increases did not overwhelm the broader expansion in demand.
A changing language-school population
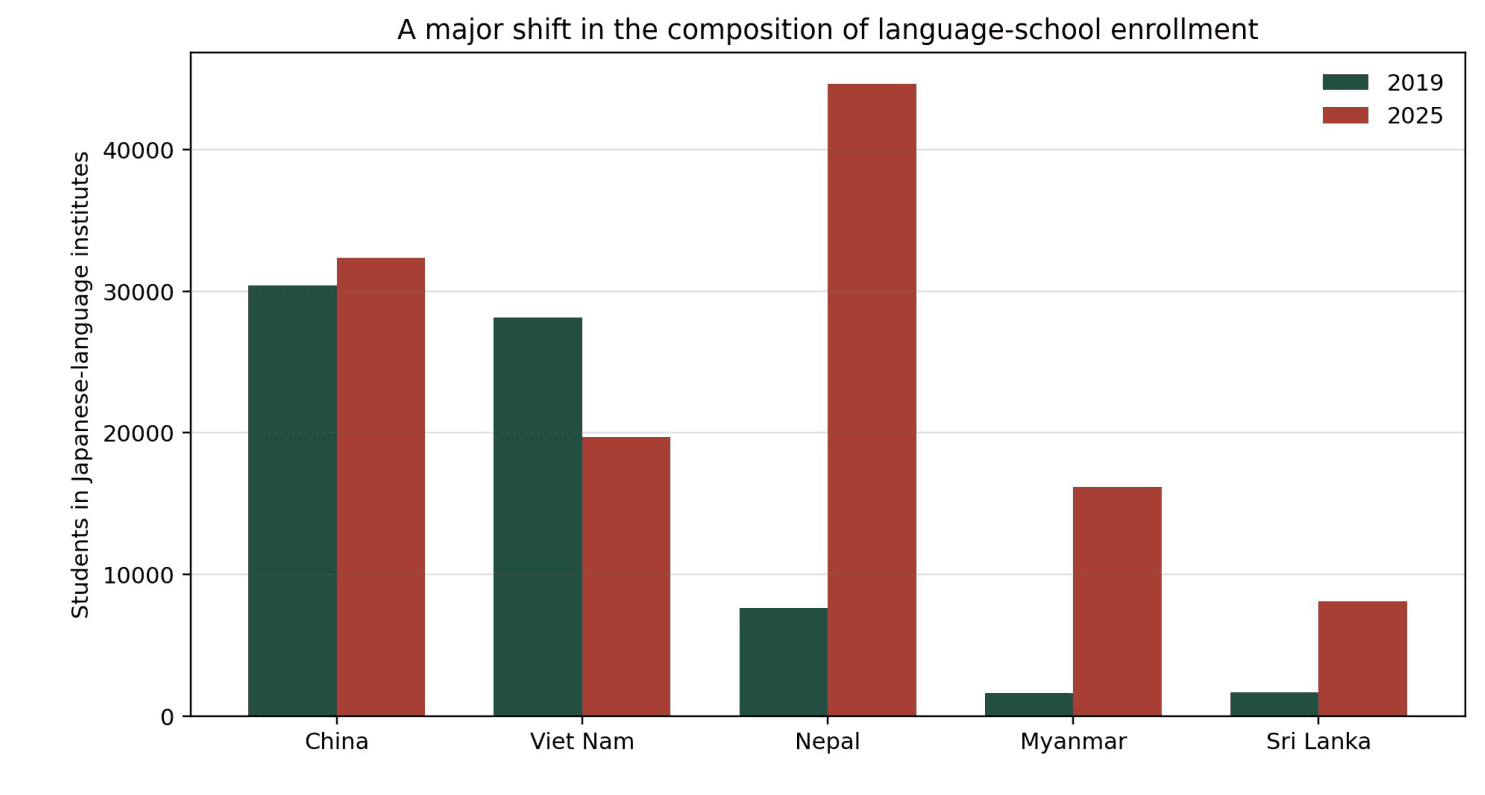
JASSO reports that enrollment in Japanese-language institutes rose from 83,811 students in 2019 to 140,174 in 2025, an increase of 67.3%. This is close to the 66.5% growth in Japan-based JLPT applications, although the statistics use different dates and populations and should not be equated.
The composition changed more dramatically. China and Viet Nam together represented roughly 70% of language-institute students in 2019. By 2025, Nepal was the largest origin country with 44,632 students, followed by China, Viet Nam, Myanmar, and Sri Lanka.
The JLPT does not publish a nationality breakdown for Japan-based N4 applicants. The language-school shift is therefore contextual evidence, not proof that any one nationality caused the N4 surge.
N4 gained institutional value in the labor market
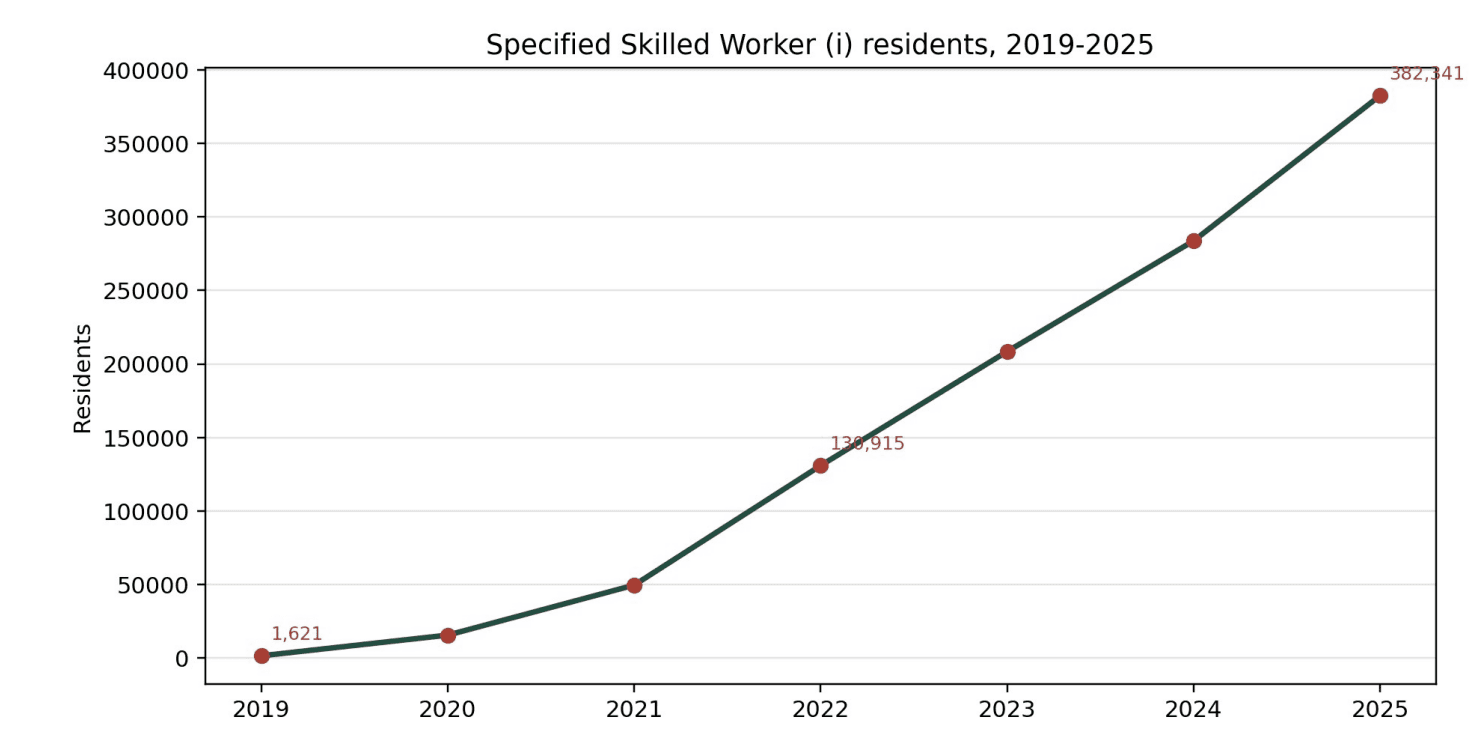
Japan introduced the Specified Skilled Worker status of residence in April 2019. Applicants for SSW (i) generally pass a sector skills test and demonstrate Japanese ability through JFT-Basic or JLPT N4 or higher. Some occupations now require N3, and qualifying Technical Intern Training (ii) transitions may be exempt.
The SSW (i) resident population expanded from 1,621 at end-2019 to 382,341 at end-2025. This does not mean those residents took N4: JFT-Basic is an alternative, and exempt transitions can bypass a language test. The framework nevertheless gives N4 a clearly recognized labor-market function that N5 does not have under the general standard.
N5 applications increased only 9.7% between 2019 and 2025 while N4 more than tripled. The pattern is consistent with - but does not prove - a shift toward a minimum credential with institutional value.
What the evidence can and cannot support
The strength of each conclusion must match the public evidence. The table separates confirmed observations, supported interpretations, and claims that remain unestablished.
| Evidence level | Claim | Assessment |
|---|---|---|
| Confirmed | N4 applications in Japan rose from 56,512 to 172,085 | Directly supported by official JLPT statistics |
| Confirmed | Foreign residents, language-school enrollment, and SSW residents increased | Directly supported by ISA and JASSO statistics |
| Supported interpretation | Application growth reflects more than population growth | Applications grew faster and the learner composition shifted |
| Supported interpretation | N4 has gained practical institutional value | The SSW (i) framework accepts JLPT N4 or higher |
| Not established | A policy or nationality caused the N4 surge | Public data do not link level, nationality, residence status, and motivation |
Conclusion: the composition of JLPT demand is changing
The strongest finding is not simply that the JLPT is getting larger. From 2019 to 2025, N4 applications increased 204.5% and their domestic share nearly doubled. N3 also grew strongly, while N1 and N5 were comparatively stable.
Three developments align with this shift: record foreign-resident growth, the post-pandemic expansion and changing origin mix of Japanese-language institutes, and N4's accepted role in the Specified Skilled Worker framework. Aggregate applications continued to expand even as the domestic fee rose from ¥5,500 to ¥7,500.
The evidence points to a structural transformation. In Japan, the JLPT is increasingly intertwined with education, migration, and labor-market pathways, not only advanced language study. A definitive causal explanation would require applicant-level data on nationality, residence status, occupation, and motivation that are not publicly available.
SOURCES
References
- The Japan Foundation / Japan Educational Exchanges and Services: Past Test Data (1984-2025)
- JLPT: Data of the July 2019 test
- JLPT: Data of the December 2019 test
- JLPT: Data of the July 2025 test
- JLPT: Data of the December 2025 test
- Japan Educational Exchanges and Services: FY2020 Business Report
- Japan Educational Exchanges and Services: FY2021 Business Plan
- Japan Educational Exchanges and Services: FY2023 Business Plan
- Japan Educational Exchanges and Services: FY2024 Business Report
- Immigration Services Agency of Japan: Foreign residents at end-2025
- Japan Student Services Organization: International Student Survey in Japan 2019
- Japan Student Services Organization: International Student Survey in Japan 2025
- Immigration Services Agency of Japan: Steps to Working in Japan - Specified Skilled Worker
- Immigration Services Agency of Japan: Specified Skilled Worker resident statistics
FAQ
Frequently asked questions
Did the Specified Skilled Worker system directly cause the N4 surge?
The public evidence cannot establish direct causality. The framework gives N4 practical value and aligns with the trend, but JFT-Basic, exemptions, and the lack of applicant-level data prevent direct attribution.
Why not divide JLPT applications by Japan's foreign resident population?
JLPT annual data count applications across two sessions, while the resident figure is a year-end stock. The same person may apply twice, and the time frames and populations do not fully match.
Did higher fees reduce JLPT demand?
The nominal fee rose 36.4% between 2019 and 2025, while Japan-based applications rose 66.5%. Fees did not overwhelm aggregate growth, but this comparison alone cannot estimate price elasticity.
NEXT STEP
Turn the decision into a realistic practice run
Use the free level check to find your range, then validate pace, listening, and consistency with a full mock exam.
PDF · 9 pages · research paper
Download the complete research paper
The PDF includes the complete charts, data tables, methodology, and references.
© 2026 Vibepapa Research. All rights reserved. Reproduction, republication, or commercial use requires permission.